Warehouse Design Optimization Methods
This part is an attempt to offer a mathematical optimization method in designing automated Storage and Retrieval System (AS/RS) warehouse. In operating system, whether production or production support such as warehouse, there is a direct correlation between storage operation complexity (for example in terms of variety and number of goods) while utilizing is necessity for higher technology level; there is also an inverse relationship between technology level and labor force number.
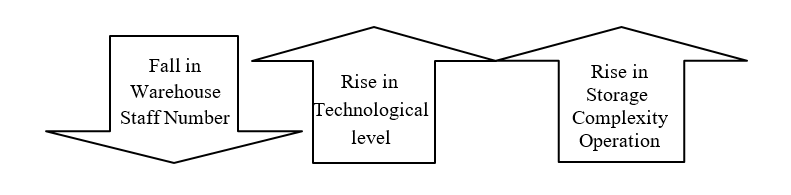
Therefore, various mix of study on above options means a systematic search for fulfilling the best technology composition, in order to reduce costs or increase capacity of technology development in operation systems particularly in ware¬houses.
Basically in Automated warehouses, especially in Automated Storage and retrieval system (AS/RS), there is a minimum case in using transmission vehicles and loading machinery and it reduced the necessary number of machines (due to optimal usage of machineries) and also the cost of operations. This can be attributed to routing and optimal use of predictable corridors in order to load and unload kinds of goods with spread distribution in storage structure). In this regard, computers suggest shortest path for loading and picking up load unit (Pallet, Box, and Carton) by using mathematical optimal Algorithm. As a result, it accelerates servicing pace with the least operation cost.
Automated Storage and Retrieval System due to its adaptive capacity with the vast range of location from various compositions and building blocks of warehouse, provides the opportunity for the designers to creatively think of arranging trends of a warehouse layout. Therefore, there are two concepts worth mentioning in designing such warehouses:
1. Adjacency plan of automated storage and retrieval warehouse with picking, arranging, and separation.
2. Types of extension patterns for automated storage and retrieval warehouses
In the following, two plans of automated storage and retrieval warehouse has been displayed that it consists of adjacency automated plan with picking, and arranging areas of the warehouse.
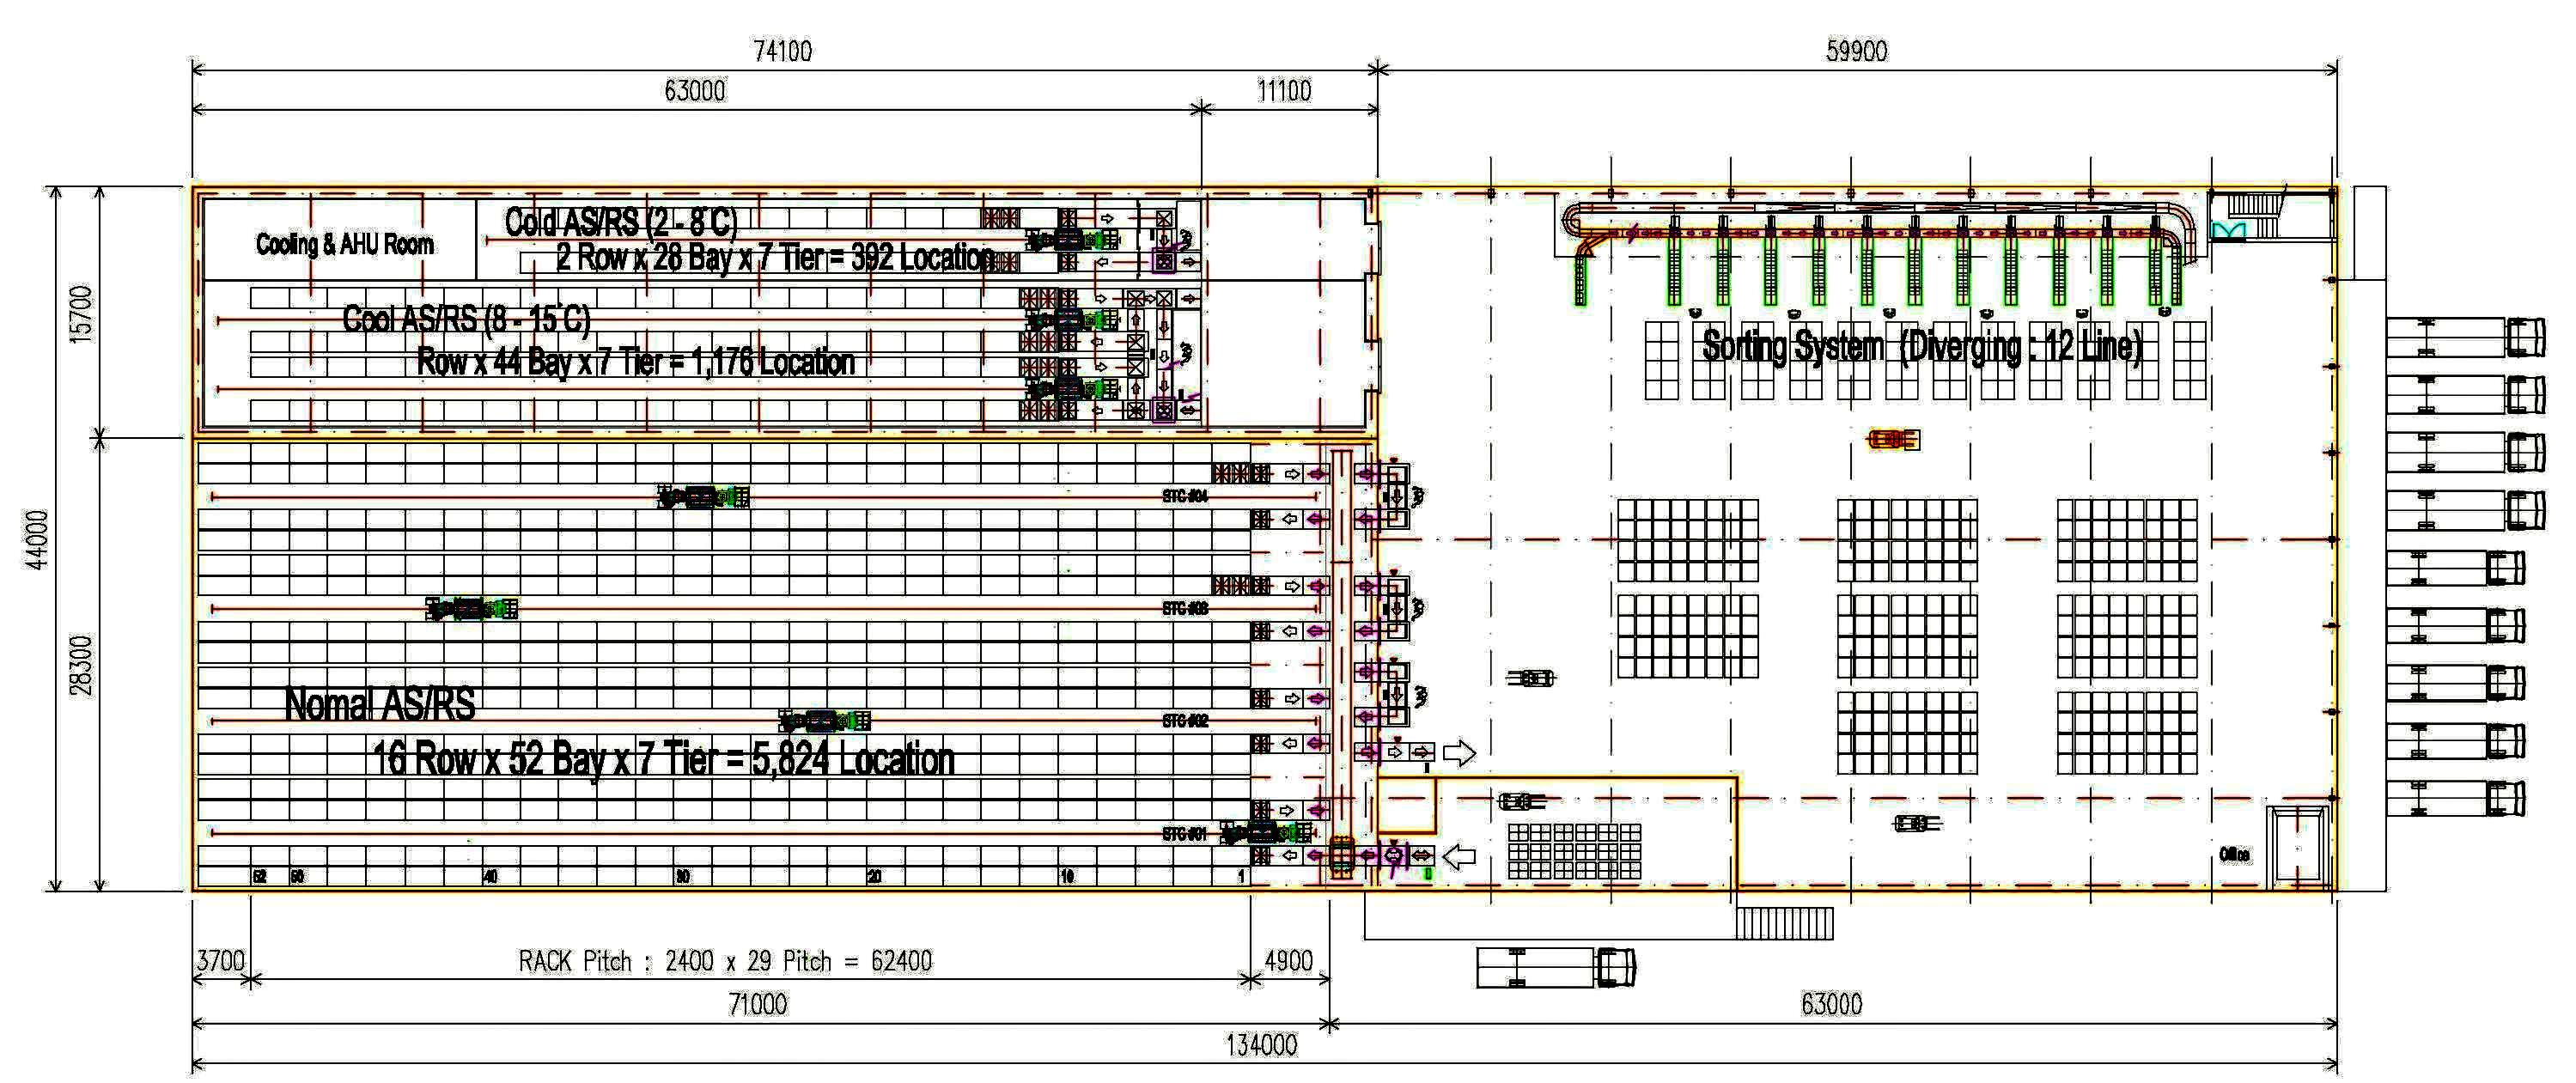
Adjacency plan of automated storage and retrieval warehouse with separation and delivery areas located on the ground floor
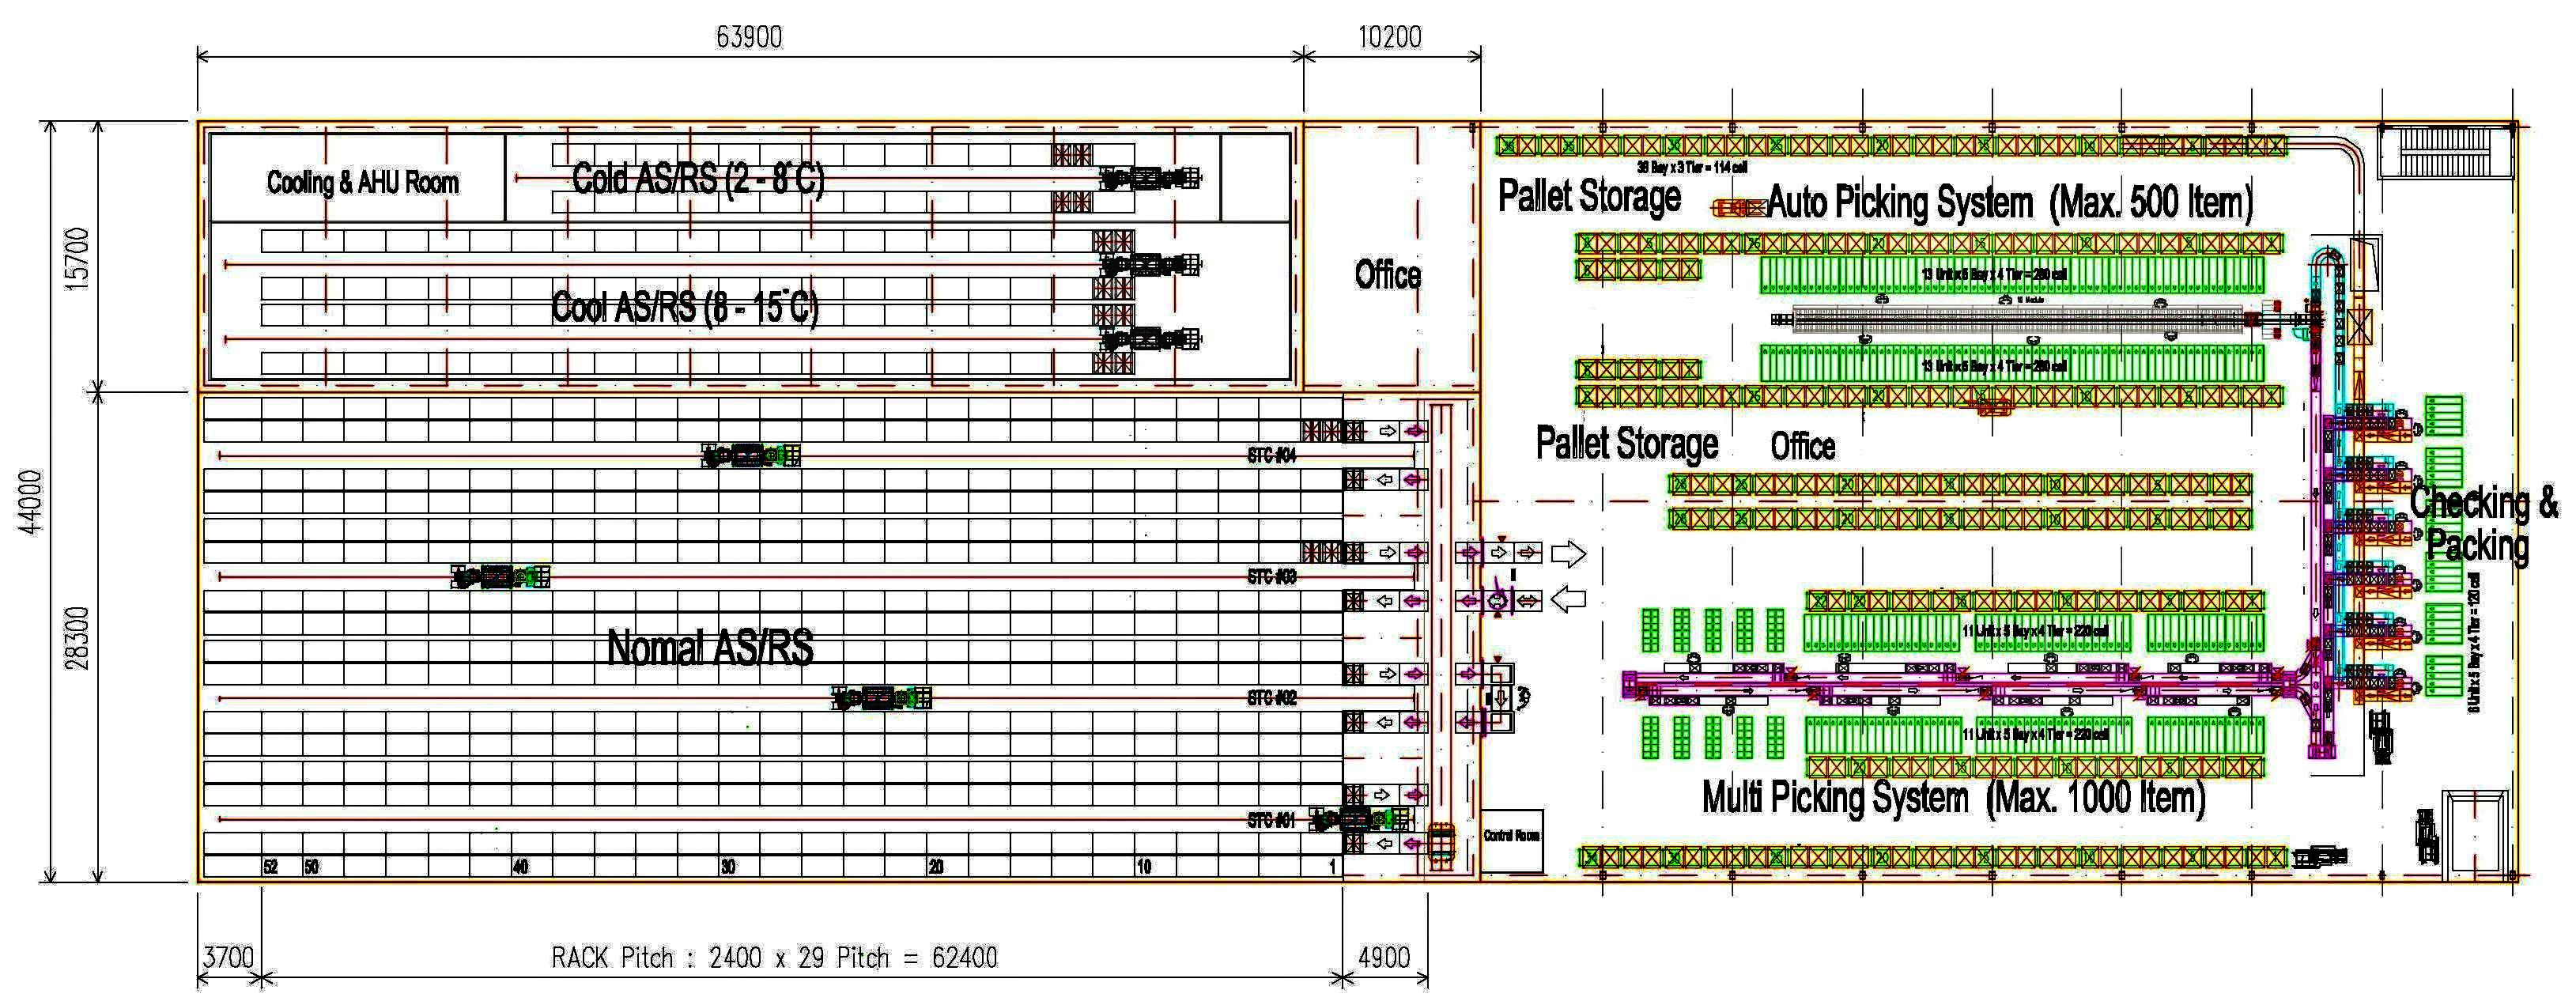
Adjacency plan of automated storage and retrieval warehouse with picking and arranging located on the first floor.
Obviously, if department adjacency is not required, then fully independent structures with the necessity to establish systematic transportation modules between storage, picking, arranging, and separation areas can be used for designing warehouse. But what is meant by extension patterns? They are various methods which permit both designers and investors to increase their available warehouse capacity equipped with automated storage and retrieval system or to run parts of the project by postponing the operation in shorter time and lower cost and to implement parts of the project with delay.

One another critical subject is accessing to optimal storage plan through the best combination of automated storage and retrieval system. One of the most important reasons in building automatic warehouses is fulfilling the maximum goal of storage capacity against the minimum costs of construction that it is possible only by using mathematical modeling techniques because of multiplicity of effective factors in designing that it will be discussed in detail here.
Optimizing the storage and retrieval warehouse plan by mathematical modeling
Automated storage and retrieval system is one of the major equipment in transmitting goods and controlling stock that has been widely used since 1960s when it was first used in production and distribution centers. As a whole, automated storage and retrieval system has a significant saving capacity to use time, space and equipment and facilitates the process of stock controlling and circulating. On the other hand, storage capability in warehouse height is a significant feature of the present technology that increases the storage ratio to surface significantly.
In spite of the wide use of automated warehouse in productive and servicing sectors throughout the world and significant success in this type of storage system, very few studies with design optimization goal of automatic storage system is evident in the history of this technology. It is clear that, the optimization of this effective element on designing this type of warehouse not only reduces construction costs but also increases the efficiency and effectiveness of equipment in this technology. In following part of this chapter, the problem, conceptual models and parameters of optimization model in Automated Storage and retrieval system is presented. Then, the developed software and the resulted achievements are reported after explaining the methodology of solving the mathematical model. Regarding the necessities and requirements, the goal to make a mathematical model and producing the related software is to develop a software package in order to optimize automated storage and retrieval storehouses according to the qualifications released by employers and stakeholders. In so doing, software system receives following data in order to analyze and optimize the plan:
1. Favorable storage capacity for employer.
2. Physical properties of goods entering to warehouse including dimension and weight.
3. Type of accessible technologies, effective in storage capacity including deep racks of one or multi pallet).
4. Land dimension limits of the storehouse (Length, width).
5. A variety of high-level warehouse structures.
6. Transport equipment properties (stacker crane) such as speed, time of servicing.
7. Purchasing cost of each stacker crane.
8. Favorable loading /unloading capacity.
9. Storage capacity in cells of shelves.
After optimal answer searching process and determining possible responses, we have demonstrated results as types of chart reports and numerical matrix. Some of them are displayed here:
1. Optimum properties of warehouse structure involve length, width, and height,
2. Number of aisles based on type of different technological classification,
3. Optimum dimension of the aisles and storage cells,
4. Number of required stacker crane to fulfil special level of services.
Statement of the Problem
Given the unique properties of the aforementioned technology, that is flexibility of dependent parameters, including lateral elements of structure (i.e., length, width, and height), internal parameters of the warehouse such as number of corridors, number of stacker crane, depth of storage in shelves, in comparison with independent parameters such as goods module properties (dimension, weight, storage capacity, favorable periodic capacity to dispatch and receive goods, etc. has been checked along with different components of parameters and effect of results on project minimum costs and storage capacity and efficiency increasing and finally, fulfilling specific level of servicing capacity are regarded as the strong points of this study. In providing this software, the whole set of inputs, users’ requirements were identified and the relation of each item were monitored and determined with other warehouse components. After finding logical relationship with other sectors of warehouse, the modeling takes place in mathematical form on the basis of these relationships that also forms the structural logic of the software.
Finally, with regard to the fact that there are many different aspects involving in optimizing store plan so this expanded mathematical model integrated with logical and technical elements, will demonstrate a vast range of possible and unique optimum cases by showing optimum and logical output.
Model components
The developed mathematical model is of two main parts based on the purpose of project:
1. Part one
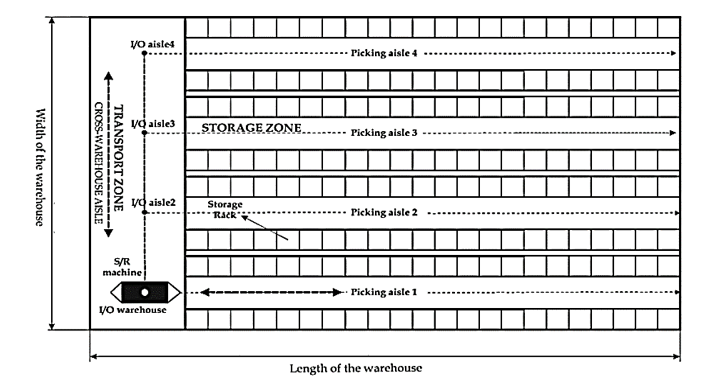
Optimizing warehouse location such as dimensional structures of shelves, aisles, goods pallet storage depth, etc. that forms optimum layout plan in general. Regarding the how of shelving warehouse in an automated storage and retrieval system, rack supported building (RSB) is basically used.
But an important presupposition in this method of goods storage is that although warehouse includes many different parts with different weight capacities, all shelves throughout warehouse have similar dimension and structural properties therefore different areas of warehouse need different foundation in proportion to loading capability of warehouse in that area so that floor structure properties can be designed, zoned, and applied to tolerate light to heavy loads (based on the type of weight classification). On the other hand, height of the shelves (floor number) has a direct effect on the nature of shelves construction because the more the height of shelving, the stronger structures it requires in order to cope with input loads (including lateral or gravity loads) and after-loading buckling.
| Light Area | Medium Area | Heavy Area | Ponderous Area |
There are probably different dimensions and weight capacities in warehouse that is related to goods carrier modules (pallets) that it is of different type in each pallet with regard to storage requirements in order to be applied to storage capacity.
2. Part Two
In second part of mathematical model, related remarks to Stacker Crane planning has been added to the first model. Therefore, in this part we look for optimizing some of stacker Crane in warehouse that it can be done with regard to purchasing cost of those machine, essential time for servicing the waiting pallets in short time (One shift), aisle properties and pallets dimensional specification.
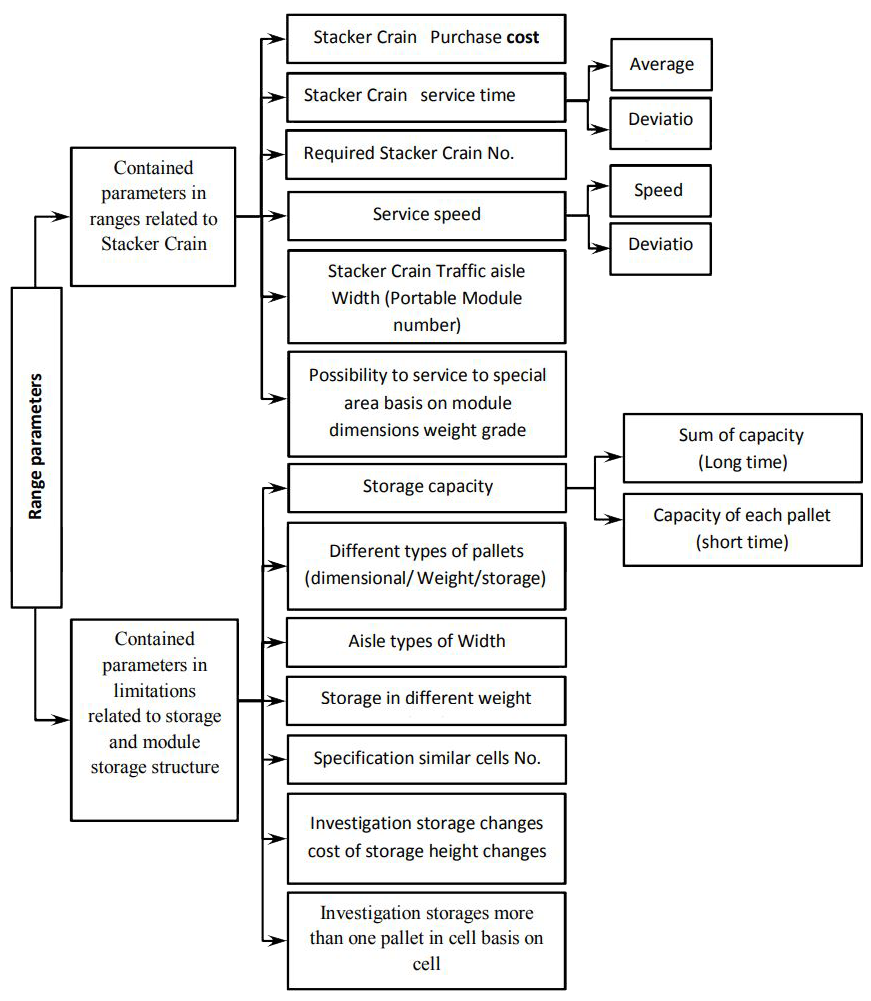
There are many cases in Stacker Crane machines that are effective in modeling and planning such as purchasing cost and each model of Stacker Crane machines. In addition, we should note that each model of Stacker Crane machine could give service to pallets or special weight part of warehouse; therefore, mathematical model should specify number of Stacker Crane machine with regard to time and speed. Since servicing location for those machines is different in each dispatch and is in one single point of warehouse; therefore, servicing time for those machines has statistically a random nature that any study and model requires related data about the average and standard deviation of servicing time. The next deciding factor is shift that specifies the maximum time of service for each Stacker Crane machine. Meanwhile, for specifying the number of those machines with regard to servicing speed of this machinery, two horizontal and vertical speeds for Stacker Crane machines should be assessed and studied. We have demonstrated of mathematical model below. Modeling goals in form of structural components of objective function in mathematical model is to be considered along with storage components and physical features (as limitation of model).
- The objective function
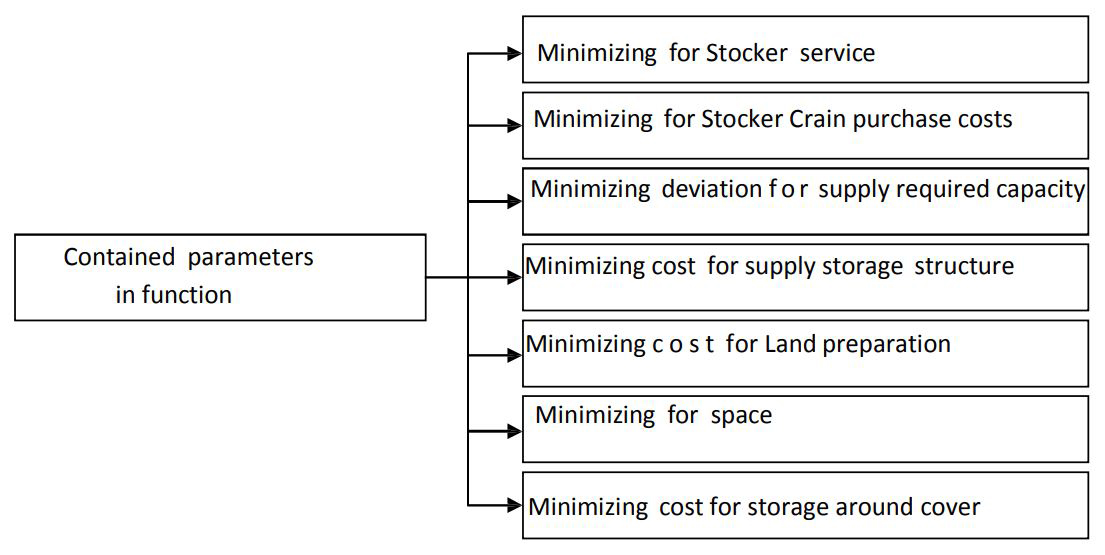
- constraints
Problem-Solving Methodology
Due to the problem complexity, two algorithm combinations of genetics and simulated annealing have been employed. Unlike the simulated algorithm, genetic algorithm annealing uses initial population for model solution, and simulated annealing provides better responses for improving a response (not a population). Therefore, combination of these two models makes the final algorithm enjoy strong points of both basic algorithms and improve the weak points to a large extent.
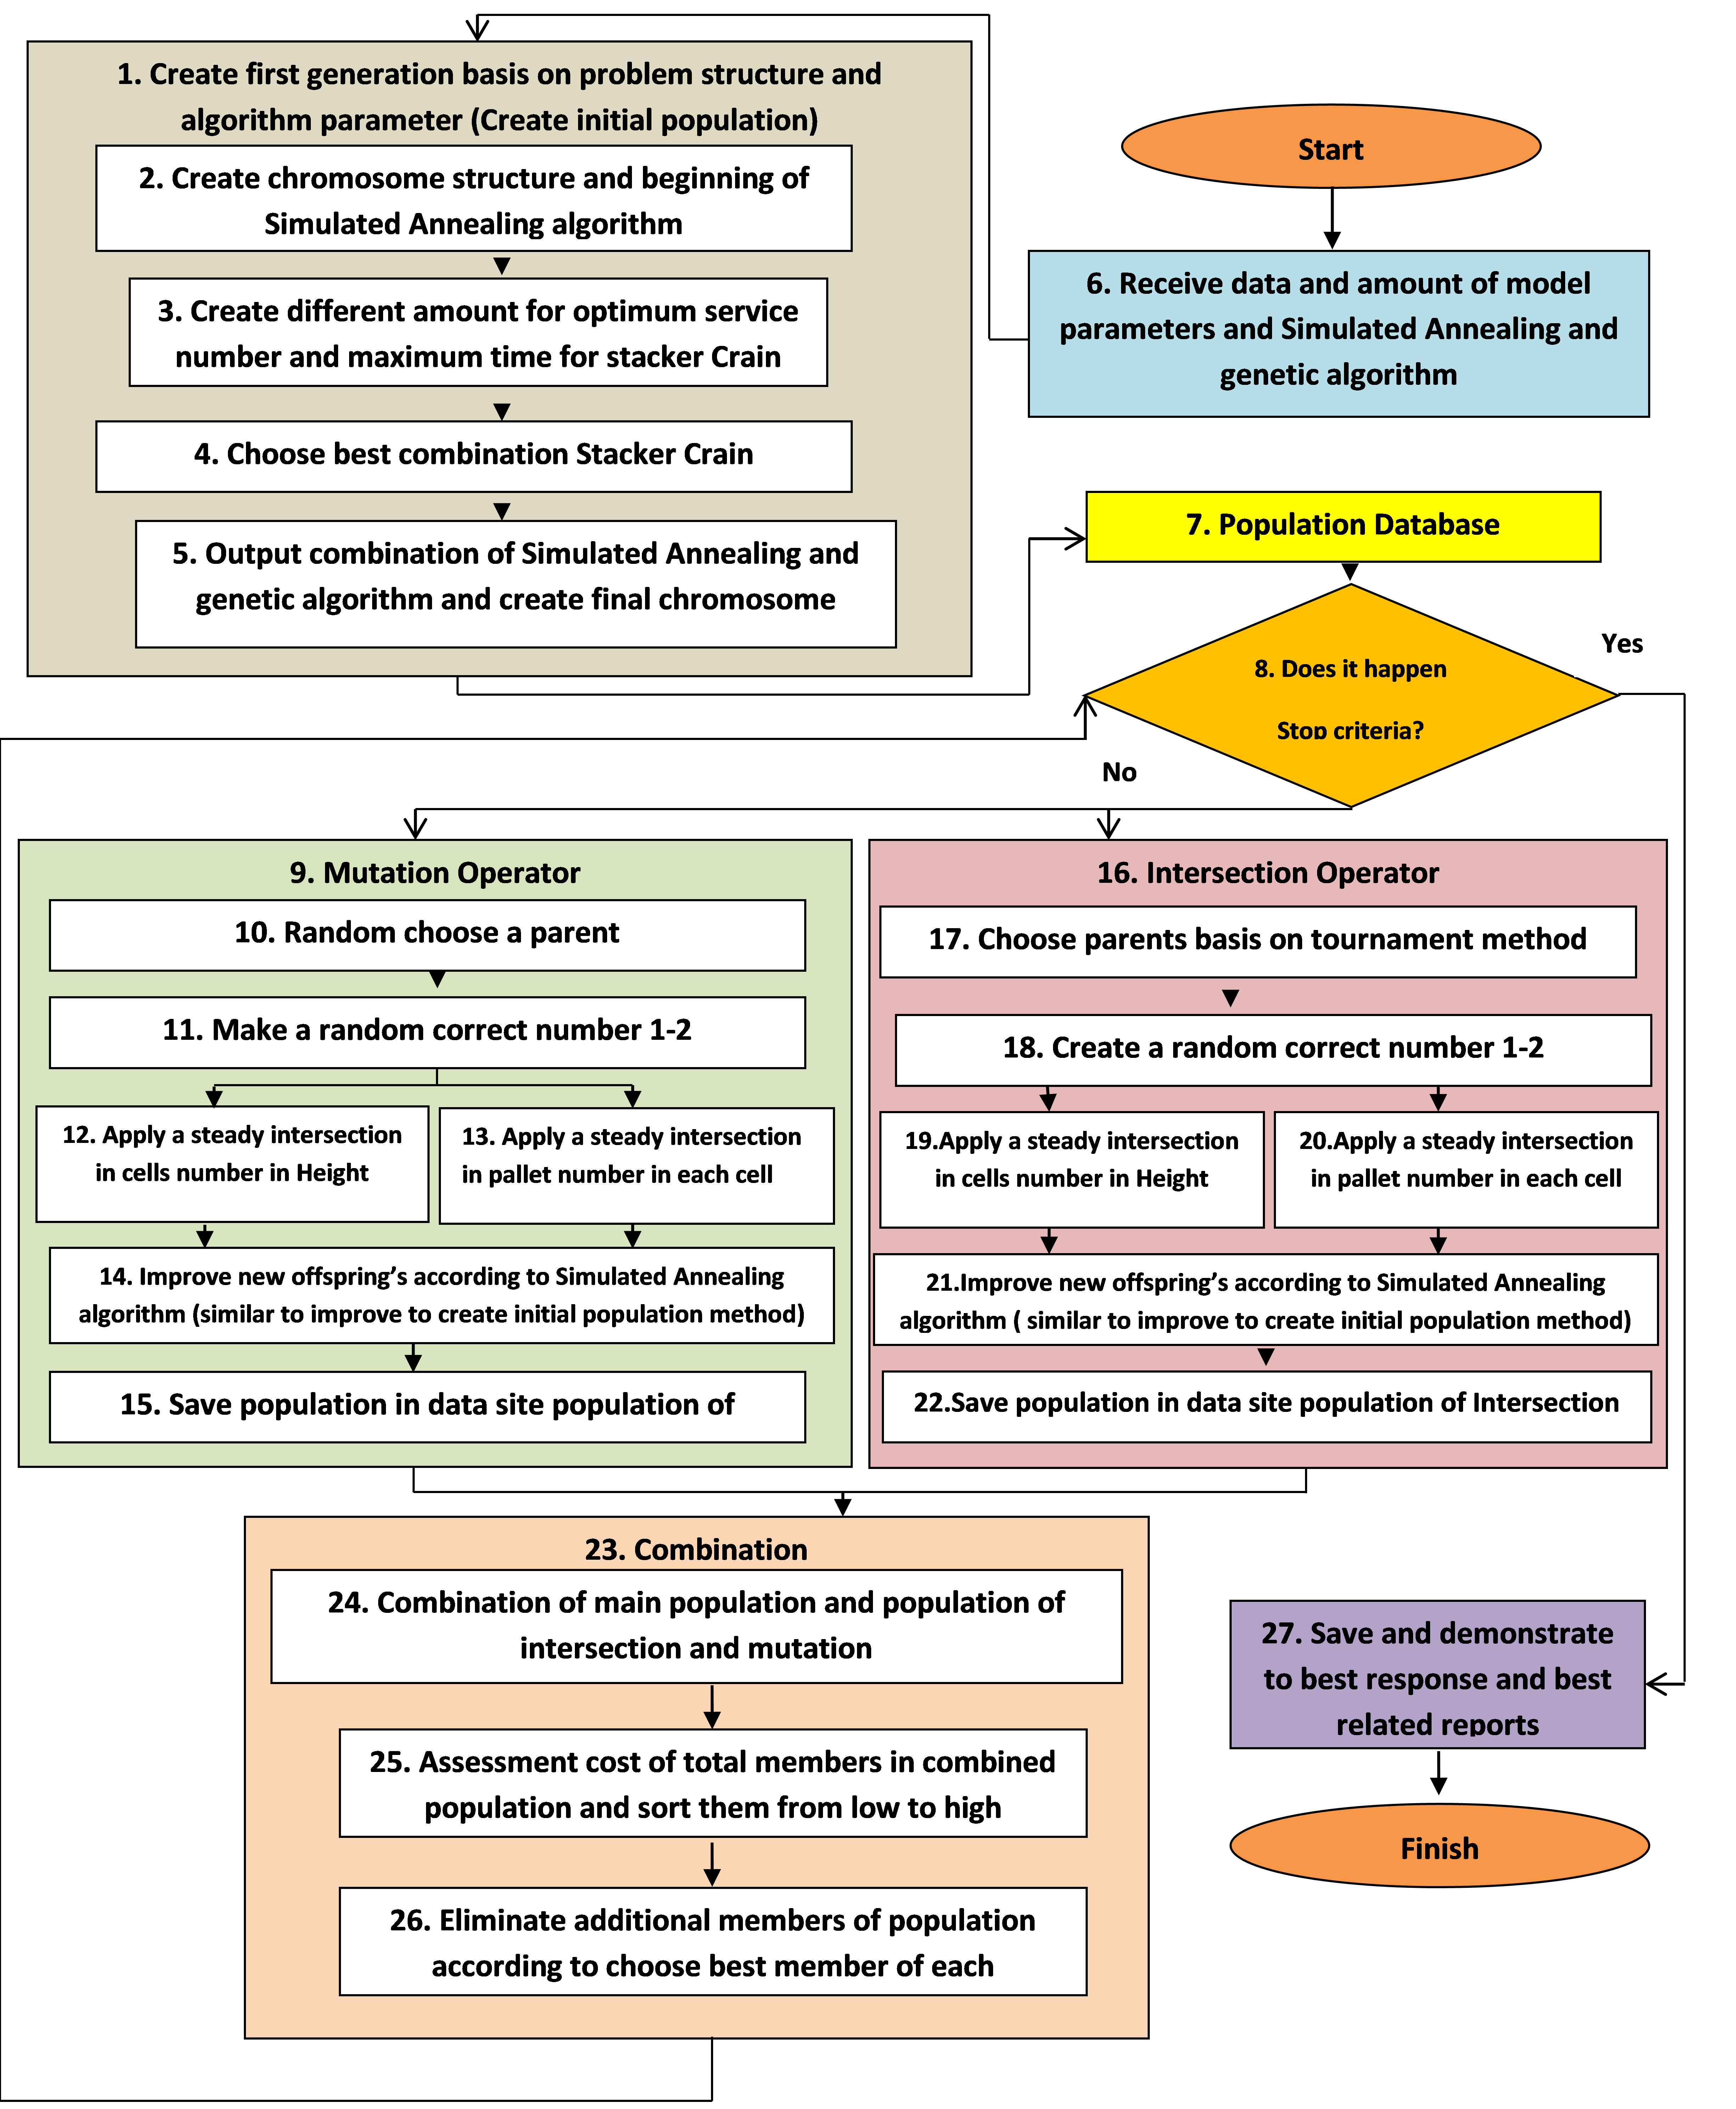
Pseudo code for the algorithm to solve the mathematical model
1. Creating first generation based on problem structure and algorithm parameter (create initial population)
2. Creating chromosome structure and beginning of Simulated Annealing algorithm
3. Creating different amount for optimum service number and maximum time for stacker Crane
4. Choosing best combination of Stacker Crane
5. Combining output of Simulated Annealing and Genetic Algorithm and creating final chromosome
6. Receiving data and amount of model parameters and Simulated Annealing and Genetic Algorithm
7. Data population site
8. Does it happen to stop criteria?
9. Mutation Operator
10. Randomly choose a parent
11. Making a random correct number 1-2
12. Applying a steady Intersection in cells number in Height
13. Applying a steady Intersection in pallet number in each cell
14. Improving new offspring according to Simulated Annealing algorithm (similar to improve creating initial population method)
15. Saving population in data site population of mutation
16. Intersection application
17. Choosing parents based on Tournament method
18. Creating a random correct number 1-2
19. Applying a steady Intersection in cells number in Height
20. Applying a steady Intersection in pallet number in each cell
21. Improving new offspring according to Simulated Annealing algorithm (similar to improve to create initial population method)
22. Saving population in data site population of Intersection
23. Combination
24. Combination of main population and population of intersection and mutation
25. Assessment cost of total members in combined population and sorting them from low to high
26. Eliminating additional members of population in terms of choosing the best member of each generation to next generation
27. Saving and demonstrating the best response and best related reports
Automated Warehouse Design Software & some of its Results
Regarding the complexity of Automatic warehouse design process and due to the multiplicity and effective elements variety in designing, and in order to facilitate the mathematical model application repetition, the WOS--a specialized software to optimize automatic warehouse has been developed in which the coding operation is done in two steps:
1. Coding the compiled model in genetics and Simulated Annealing algorithms format
2. Making graphical interface in order to facilitate its usage
For this purpose, a graphical interface has been designed so that the users can record required information for the model step by step and finally after running the model, they can receive different types of reports and required analysis in format of chart report or numerical tables. These reports are for determining storage optimum design, storage structure optimum features (length, Width, height) aisle number with proper depth storage, aisles’ optimum dimensions and storage cells and required Stacker Crane number in order to fulfill special level of servicing capacity
- Coding the compiled model in genetics and Simulated Annealing algorithms format
- Making graphical interface in order to facilitate its usage
For this purpose, a graphical interface has been designed so that the users can record required information for the model step by step and finally after running the model, they can receive different types of reports and required analysis in format of chart report or numerical tables. These reports are for determining storage optimum design, storage structure optimum features (length, Width, height) aisle number with proper depth storage, aisles’ optimum dimensions and storage cells and required Stacker Crane number in order to fulfill special level of servicing capacity.
Mathematical Model Solution
Inserting and saving basic information and data, during problem-solving process, the result can be achieved through types of DSS report in the format of two and three dimensional diagrams and also possible response matrix.
Two and three dimensional diagrams: These diagrams are set for better understanding of complicated results (problem solving) and comparing effective parameters in designing. Therefore, in WOS software, it is possible to achieve variable compounds of octoploid elements such as:
- Total project cost
- Total Stacker Crane number
- Total aisle number
- Total constructed capacity (storage cells)
- warehouse aisle length
- Warehouse total width
- Warehouse height
- Warehouse total area
Chart reports are divide into two categories of pre-assumed report (constant format) and report-maker part (in order to make custom reports). In pre-assumed report parts, the users can use types of charts in pre-designed forms but in report-maker part, it is possible to make types of chart custom reports via combination of variable effective parameters in designing.
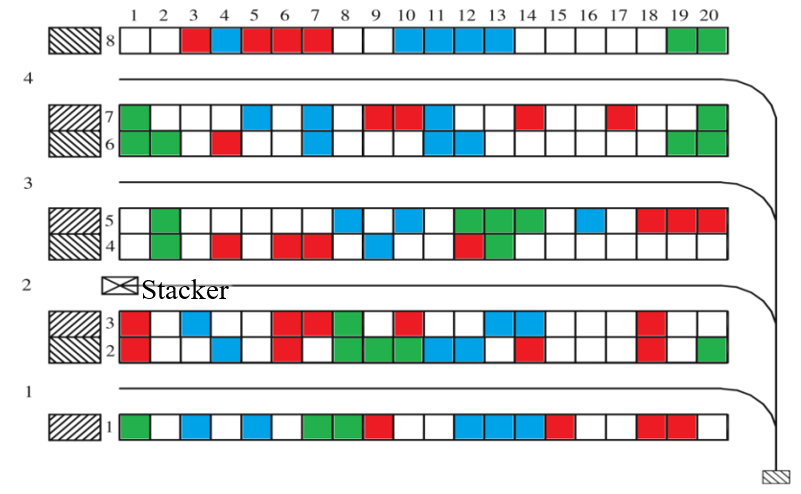
There is a sample of pre-assumed report in the chart below. The Stacker Crane machines applied in designing are compared with an achievable capacity and with regard to the number of corridors.
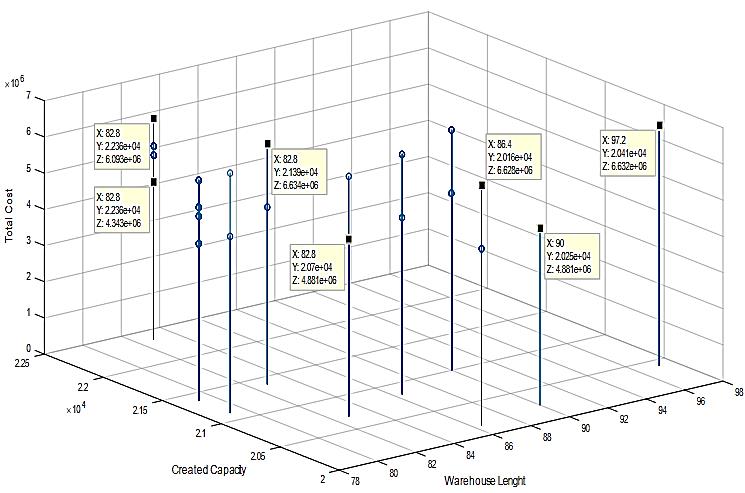
The chart below is sample of three-dimensional one that compares storage length (X axis) built capacity (Y axis) and total cost of storage construction (Z axis).
Feasible Solution Matrix
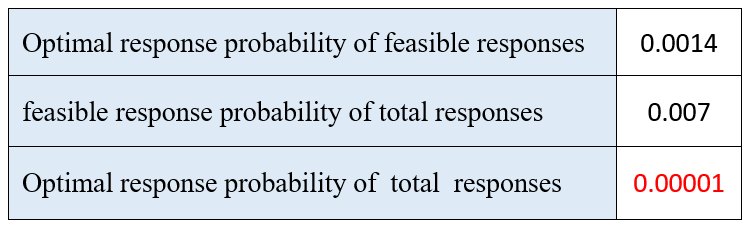
All results of mathematical model application have been demonstrated in columns, consisting of effective elements in designing (decision indicators). Each line of this Matrix is also an acceptable response and the values are assigned to its response indicators in order to be used in automated warehouse plan optimization. Regarding the vast spectrum of accessible responses in a proper space and in spite of the possibility of prioritizing decision indicators in many different methods such as color spectrum application are to facilitate categorization and identification of response groups. But due to variety of indicators and heterogeneity in scale, we have to use the methods based on paired comparisons such as TOPSIS technique to assess and prioritize these solutions.
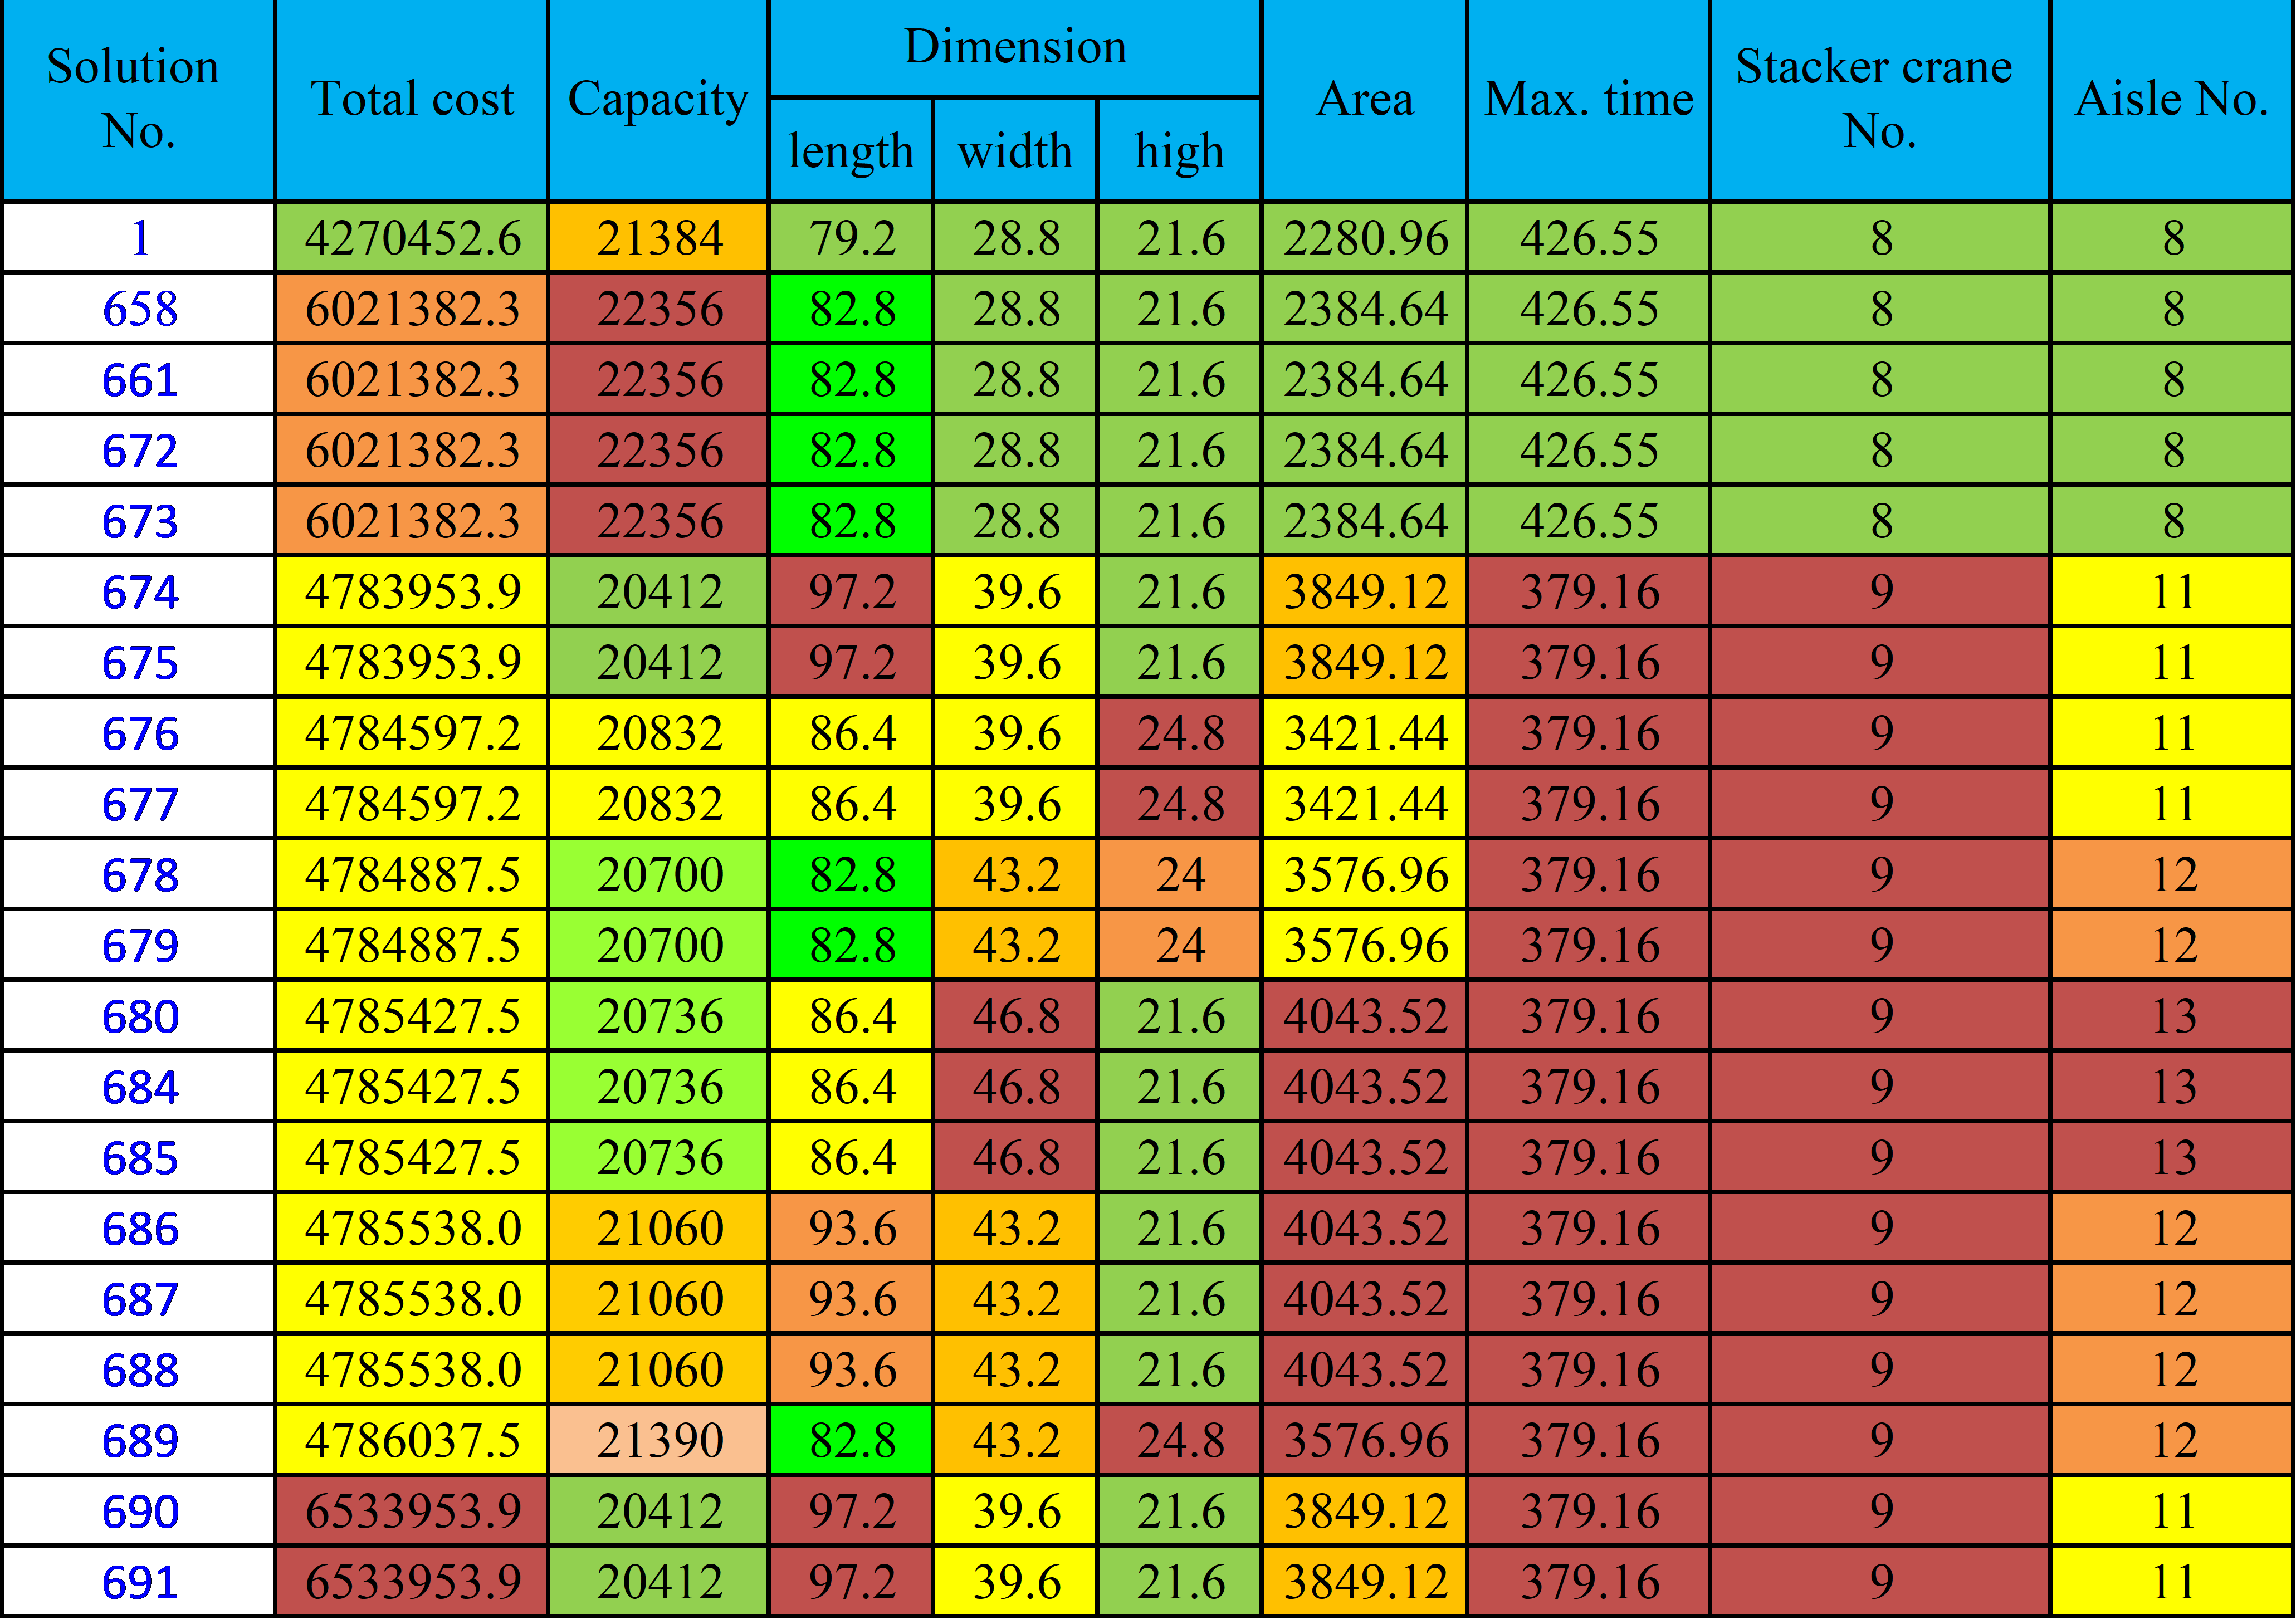
The most optimal automated storage structure (first priority): consists of a row from the table below. The next priority is in the second row.
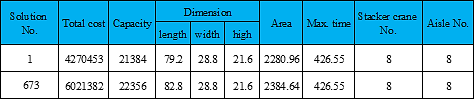
The significant point is, in this example in the case of not using the methodology applied in this chapter is to specify automated and retrieval warehouse designing elements and with regard to 692 possible responses, the probability of identifying optimum response in possible response range (low cost and most expected capacity for the project is equal to 0.00145 = 1 /692 It should be noted that the discussed problem cost amount in storage establishment cost column are dramatically different even the first two responses and second.